

![Where's my Voi scooter: [7] Analysis of scooter battery with graphs](https://cdn.hashnode.com/res/hashnode/image/upload/v1657567482911/qUzLkT1ol.png?w=1600&h=840&fit=crop&crop=entropy&auto=compress,format&format=webp)


Table of contents
I will be trying to learn from the data set I collected, starting with the battery of scooters.
Deal with missing data
Because of my data collection program crashing, there are some data missing, I now need to find them out, so that I don't mess up my data analysis by making incorrect assumptions.
Finding missing data
I am going to iterate through all the data I have and check the separation between it and the previous data item. The data is collected every 1 minute, so any time longer than that indicates there is something wrong. But since running the program also takes time, the separation should be 1 minute + the duration of each loop. There might also be cases where there is a slight error and the program skips a minute. So I will check for data separated by more than 3 minutes to be safe.
def find_missing_data():
    battery_level_df = store['battery_level_df']
    previous_timestamp = battery_level_df.index[0]
    for current_timestamp in battery_level_df.index:
        if current_timestamp - previous_timestamp > pd.to_timedelta("3 minutes"):
            print(f"Missing data from {previous_timestamp} to {current_timestamp}")
        previous_timestamp = current_timestamp

find_missing_data()
The program finds that there are missing data in the following positions:
Missing data from 2022-06-02 21:59:47.420510 to 2022-06-02 23:24:21.071122
Missing data from 2022-06-04 14:46:03.130303 to 2022-06-05 19:08:46.083742
Missing data from 2022-06-15 09:04:56.485744 to 2022-06-17 21:15:31.558383
Missing data from 2022-06-22 09:05:24.070133 to 2022-06-22 15:09:05.898395
Finding day cuts
Scooters are available from 6 am to 10 pm, so knowing when the day starts and ends is important to our analysis. Since there is no direct way to tell, I need to find them out.
It works by iterating through the timestamp and vehicle count array, then whenever the vehicle count drops the zero, we know it is 10 pm and the day ended, and we set zero_flag to True, then when the vehicle count leaves zero while zero_flag is True, we know it is 6 am, this repeats until the last data item.
def find_day_cuts():
    timestamp_np_array = np.load('cached_data/timestamp_np_array.npy', allow_pickle=True)
    vehicle_count_np_array = np.load('cached_data/vehicle_count_np_array.npy', allow_pickle=True)
    zero_flag = False
    for index, item in enumerate(zip(timestamp_np_array, vehicle_count_np_array)):
        if item[1] == 0 and not zero_flag:
            print("become zero", index, item[0])
            zero_flag = True
        if zero_flag and item[1] != 0:
            print("leave zero", index, item[0])
            zero_flag = False

find_day_cuts()
The program outputs each day like this:\ become zero 594 2022-06-02 23:24:21.071122\ leave zero 930 2022-06-03 05:00:53.124146
Analysis of battery
Individual scooter
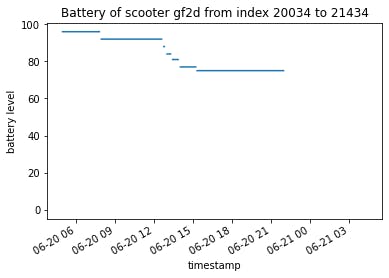
I am going to analyse the battery of a scooter. I first read the dataframe from the HDFS storage, then I generate the series from the dataframe, and change the first and last value to zero so that it will not be skipped.
def plot_scooter_battery(starting_index, steps, scooter_id):
    global battery_level_df
    series = battery_level_df.iloc[starting_index: starting_index + steps, battery_level_df.columns.get_loc(scooter_id)]
    series[0] = 0
    series[-1] = 0
    fig, ax = plt.subplots()
    fig.patch.set_facecolor('white')
    series.plot(title=f"Battery of scooter {scooter_id} from index {starting_index} to {starting_index + steps}", xlabel="timestamp", ylabel="battery level", ax=ax)

plot_scooter_battery(930,1400,'npv9')
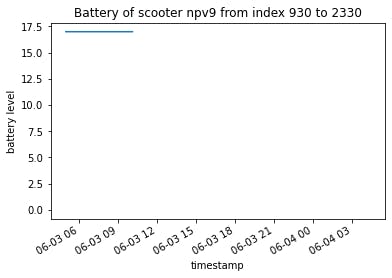
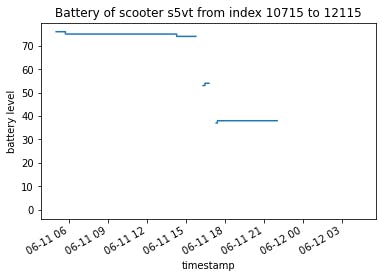
To illustrate my point, the graph without skipping zero looks like this
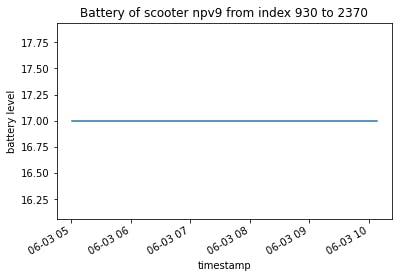
By setting the last item in the series as zero, the graph is forced to be extended, so we can see the whole thing.
Critical mistake
Then I realized that by changing the starting and ending value of the series, I actually accidentally edited the dataframe that I am not supposed to edit. This is because by calling the iloc function, the returned series is actually a reference, instead of a copy, so any edit done to that reference will reflect on the dataframe as well.
I was afraid that I have to re-run the function which took an hour to run to make the dataframe again. Luckily, I didn't save my edit to the HDFS storage, so I could load it again.
So I changed the function to make a copy of the series by calling .copy(), and I only edit the series if it is NaN, the updated function is:
def plot_scooter_battery(starting_index, steps, scooter_id):
    global battery_level_df
    series = battery_level_df.iloc[starting_index: starting_index + steps, battery_level_df.columns.get_loc(scooter_id)].copy()
    series[0] = 0 if pd.isnull(series[0]) else series[0]
    series[-1] = 0 if pd.isnull(series[-1]) else series[-1]
    fig, ax = plt.subplots()
    fig.patch.set_facecolor('white')
    series.plot(title=f"Battery of scooter {scooter_id} from index {starting_index} to {starting_index + steps}", xlabel="timestamp", ylabel="battery level", ax=ax)
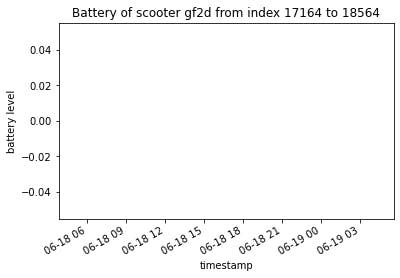
Other graphs
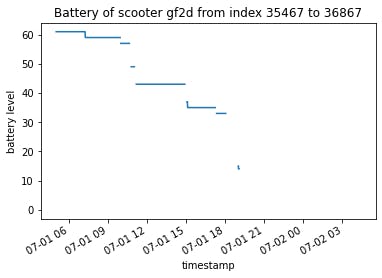
what happens when that scooter is not available on that entire day
Mean battery level of all scooters
Difficulty
This plot sounds simple at first, I just have to use the mean() function from pandas and everything is done. The challenge is with NaN values, there are scooters that are not available for the entire day, and there are also scooters that are being used.
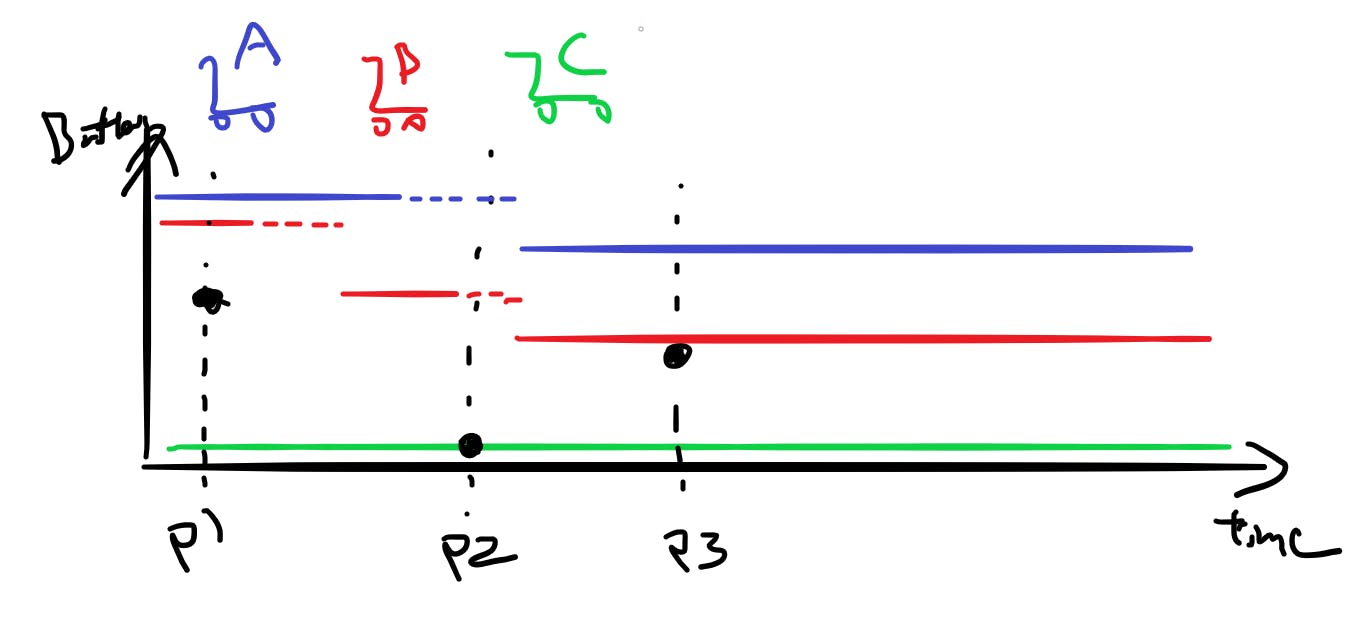
To illustrate my point, I drew this simulation, there are 3 scooters, scooters A, B and C, the line is its battery level, in between the lines is the time when the scooter is being used, and the value is NaN. At p1, no scooter is being used, so the mean is the mean of all scooters. At p2, scooters A and B are being used, so they are not being used to calculate the mean, so the means is the remaining scooter, scooter C. At p3, all scooters are back, so the mean goes back up.

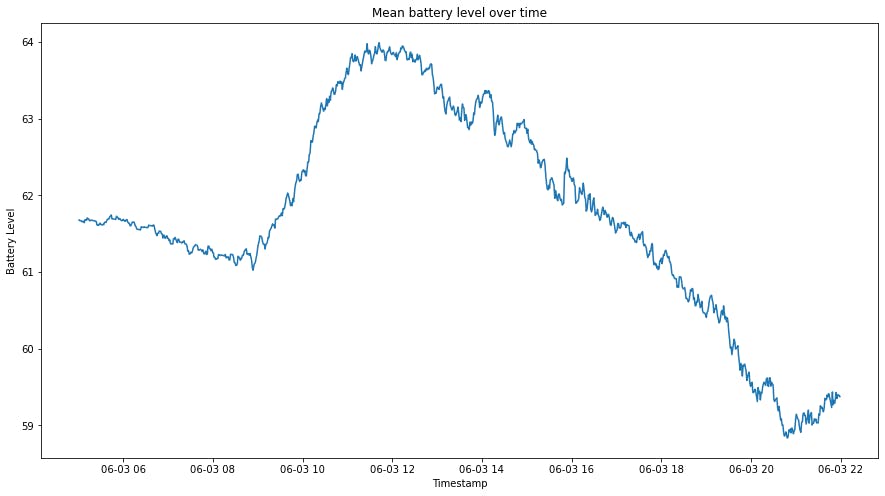
This isn't the real mean battery of all scooters. This is what the graph looks like without any editing.
Plan of action
Ideally, I want to fill in the blanks with a line going from the previous point to the next point, as if the battery consumption is linear. However, that would be difficult. When I am iterating through the elements, I'll have to find the point when the data stops for a particular scooter, go forward until the data reappear, and fill in the data linearly. That is fine for a scooter, but will be very difficult with so many scooters.

Moreover, with so many scooters, a forward fill, where I fill NaN values with the previous value will work very similarly because of the sample size.
So what I did is to first copy the specific area of the dataframe I want to analyse and copy it, so I won't change the original dataframe. Then I use the dropna() function to drop columns where all the values are NaN, meaning that particular scooter wasn't available that entire day, and we don't need it. Then I looped through all the elements in the copied dataframe to fill in the NaN values.
starting_index = 930
steps = 1945-930

battery_level_df = store['battery_level_df']
selected_area_df = battery_level_df.iloc[starting_index: starting_index + steps].copy()
selected_area_df.dropna(axis='columns', how='all', inplace=True)
selected_area_df_without_filling_nan = selected_area_df.copy()

for row_num, (row_index, row_content) in enumerate(selected_area_df.iterrows()):
    for item_num, (item_index, item_content) in enumerate(row_content.iteritems()):
        if pd.isnull(item_content):
            selected_area_df.iloc[row_num, item_num] = selected_area_df.iloc[row_num - 1, item_num]
Then I plot it using the following code:
plt.figure(facecolor='white', figsize=(15, 8))
plt.plot(selected_area_df.mean(axis=1))
plt.ylim([55,65])
plt.title("Mean battery level over time using my own way to fill na")
plt.xlabel("Timestamp")
plt.ylabel("Battery Level")
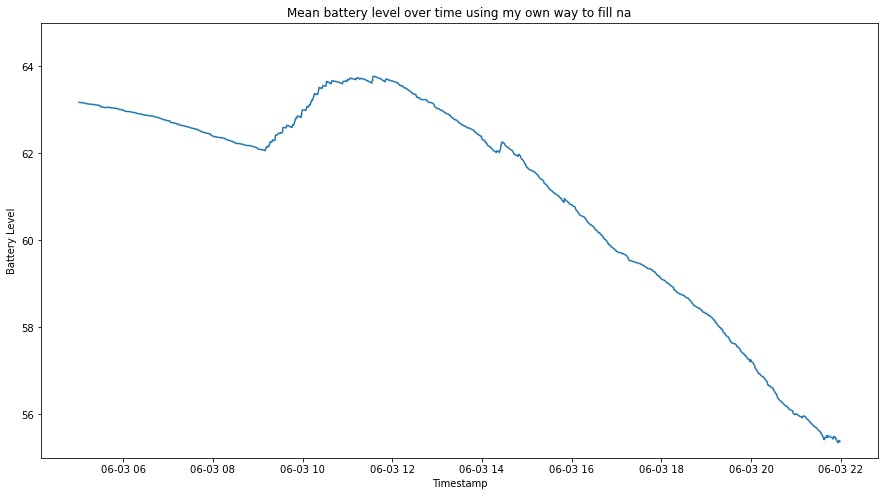
But then I realized that I can use the inbuilt fillna function with the ffill method, which forward fills the value. I ran the function and plotted the graph, this function ran faster than my own.
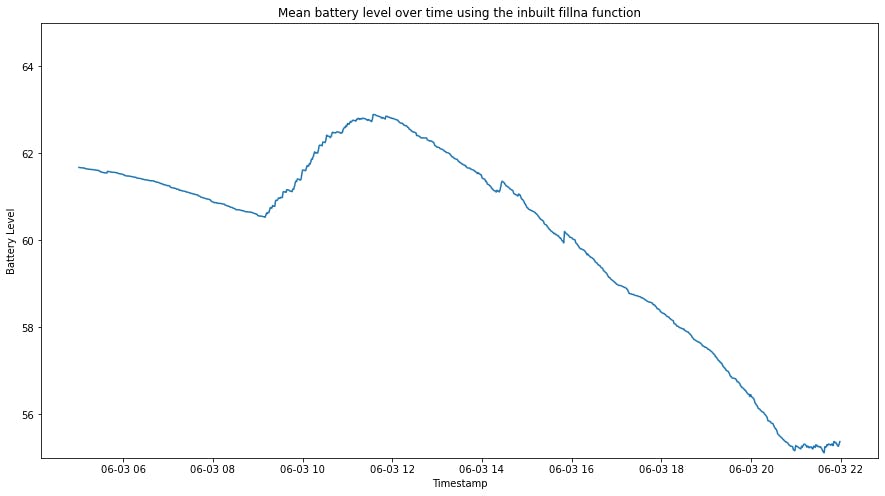
Different results from my implementation and the inbuilt method
But very confusingly, although these two plot looks similar, there are some very minor differences. These two functions are supposed to work the same way, therefore I think I have to investigate what caused the differences.
I suspect it is because in my implementation, I did selected_area_df.iloc[row_num, item_num] = selected_area_df.iloc[row_num - 1, item_num], if the first element is NaN, the value from the end will be used to fill it because of how negative indices works. I investigated and found there are some scooters that were initially unavailable, but then were activated in the middle of the day. That is why the result is different, I forgot about the edge case.
Assumption about the data
This brings me to the problem, what should I assume about the scooters that aren't available at the start? There are 3 possibilities:
- It was broken and had to be fixed
- It was out of battery and need a battery replacement
- It was being used, but this is not possible, because it is just after the scooters are available, so no one has time to unlock scooters yet
I think most of them will be out of battery instead of broken, so I plan to fill the lowerest value of battery to them, I know for a fact that scooters don't get deactivated when they hit zero, they usually are deactivated before that to prevent accidents where a scooter run out of battery mid-ride happen, so the problem is when, when does the scooter get diactivated? I looked through the dataframe, and usually, the scooter gets deactivated when they reach 8 per cent battery, so I will assume scooters that are not available at the start of the day are at 8 per cent battery.
To compare, I kept the same y limit to this graph, as you can see, the average battery count decreased a lot.
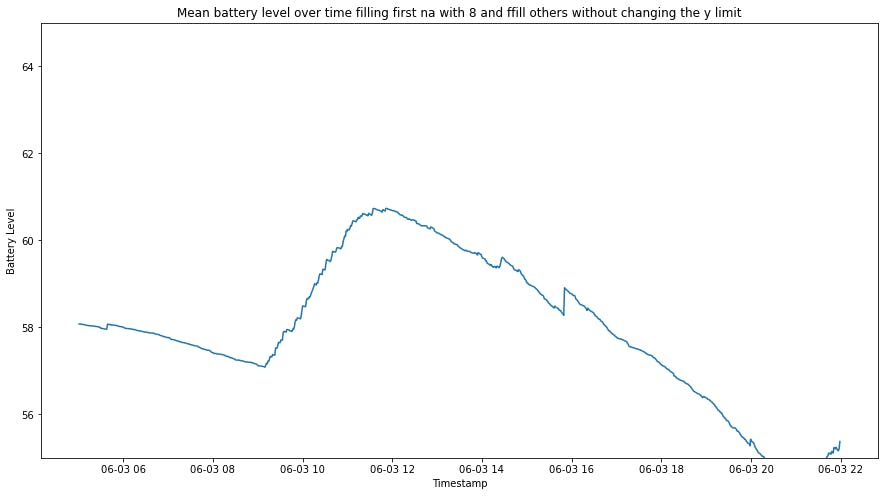
My assumptions were incorrect
This is actually still inaccurate, as at the end, let's say a scooter is unlocked with 15 per cent battery left, when it is locked if the battery level is lower than 8 per cent, Voi don't want you to unlock it again, so the scooter will not be available again, in this case, we incorrectly assume the battery is still at 15 per cent because of forward filling, when in fact it should be 8 or less per cent.
I intend to fix it by filling all NaN values at the end with 8 per cent, and backward fill only those values up until they were last unlocked, I believe this will give us a more realistic view of the battery condition.
I am thinking of a shortcut, which is to forward fills the first half and backwards fill the second half, this would be fast, and create mostly what we want, except there will be a jump in the middle
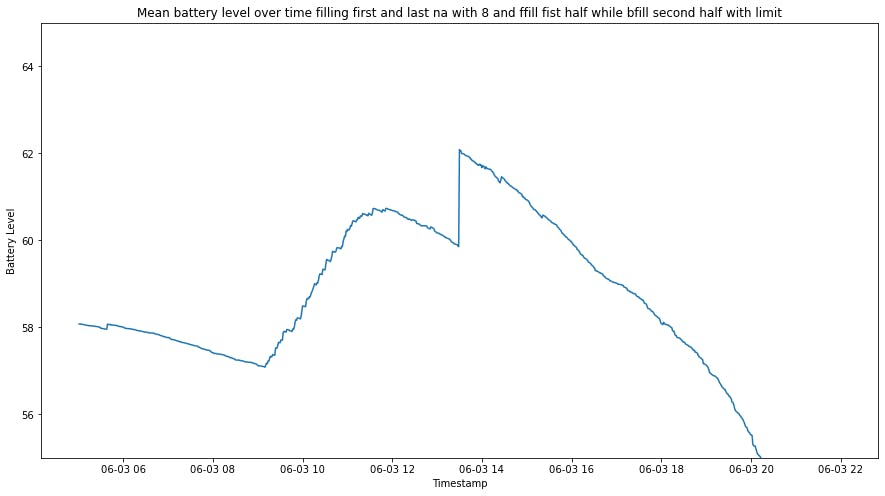
as you can see, this is very problematic.
My assumptions were still incorrect
I found out that some scooters are disabled while having 50% battery or above, which means they are not disabled because of a lack of battery, but for other reasons, that is why assuming scooters end with 8 per cent battery is so wrong.
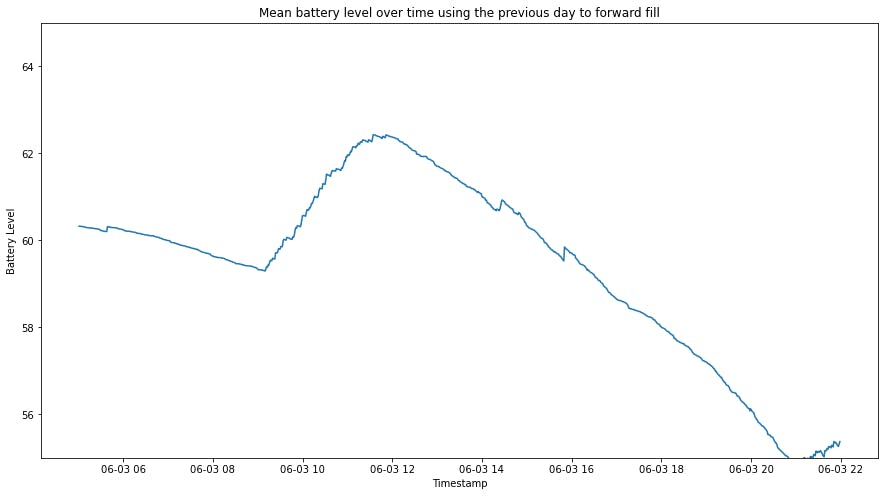
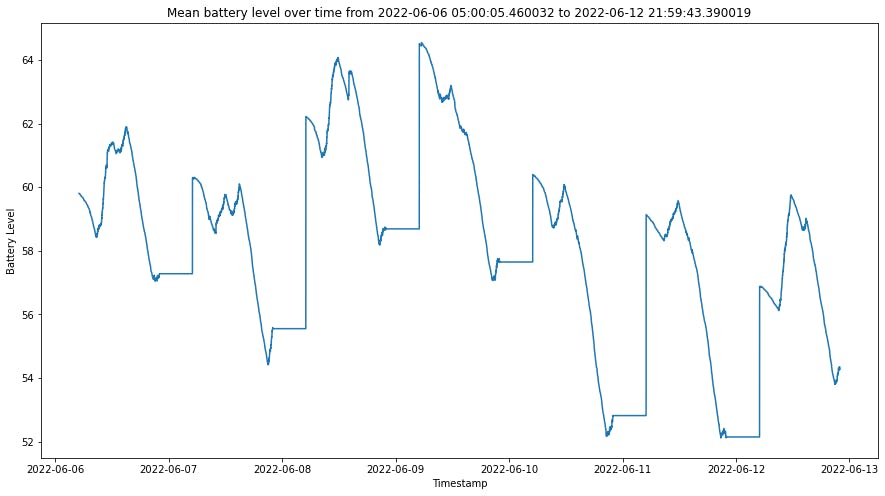
My solution is to use the previous day to find the last seen battery count. I first compute the one_day_before_index, which is either one day before the starting index, or 0 when we don't have the data for one day before. Then I first get the columns of data used for that specific day, then I use forward fill on the data plus one day before, then cutting the previous day, so that the data is in the desired range.
final code
def plot_mean_battery(starting_index, ending_index):
    one_day_before_index = max(starting_index - 1440, 0)
    starting_diff = starting_index - one_day_before_index
    battery_level_df = store['battery_level_df']
    columns = battery_level_df.iloc[starting_index: ending_index].dropna(axis='columns', how='all').columns
    selected_area_df = battery_level_df[columns].iloc[one_day_before_index: ending_index].fillna(method='ffill')[starting_diff:]
    plt.figure(facecolor='white', figsize=(15, 8))
    plt.plot(selected_area_df.mean(axis=1))
    plt.title(f"Mean battery level over time from {selected_area_df.index[0]} to {selected_area_df.index[-1]}")
    plt.xlabel("Timestamp")
    plt.ylabel("Battery Level")

plot_mean_battery(3539, 13166)
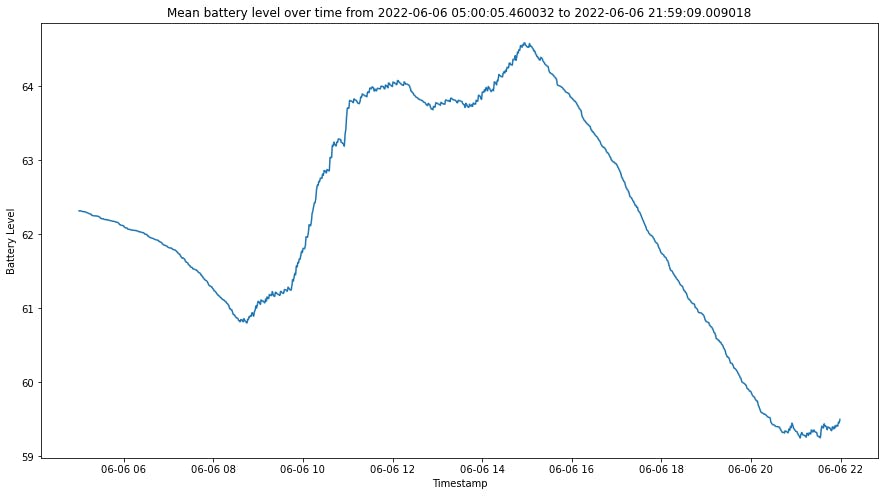
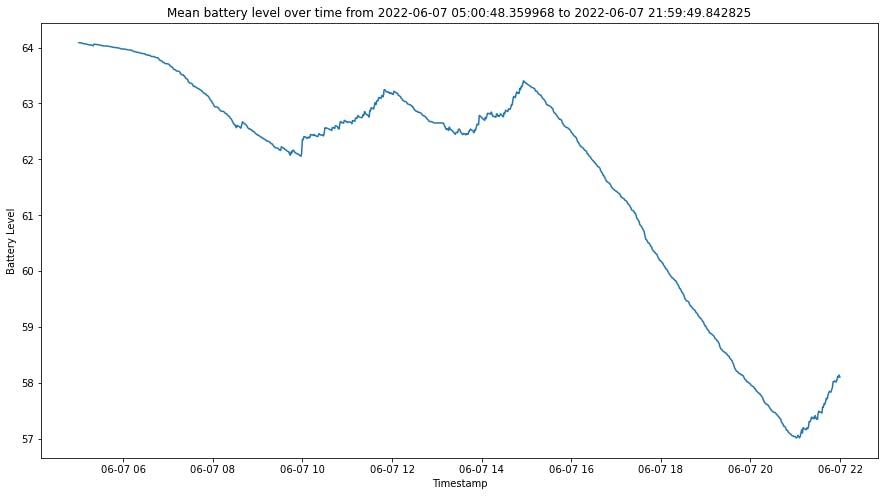
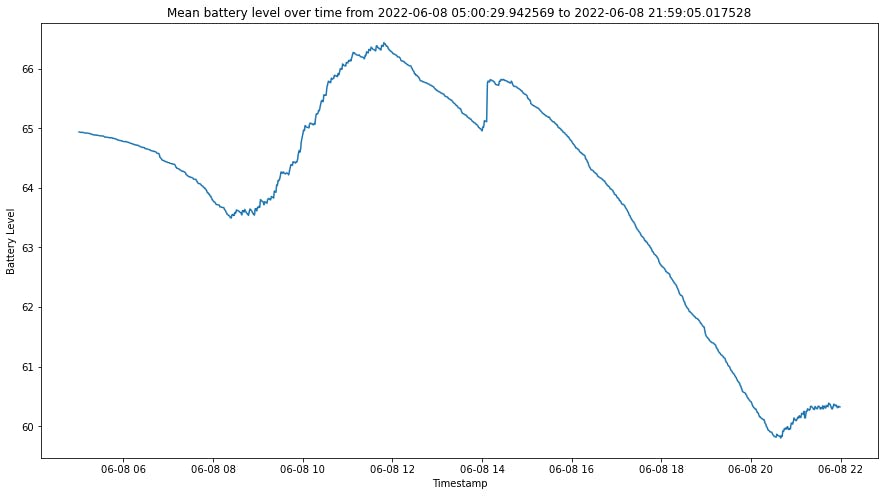
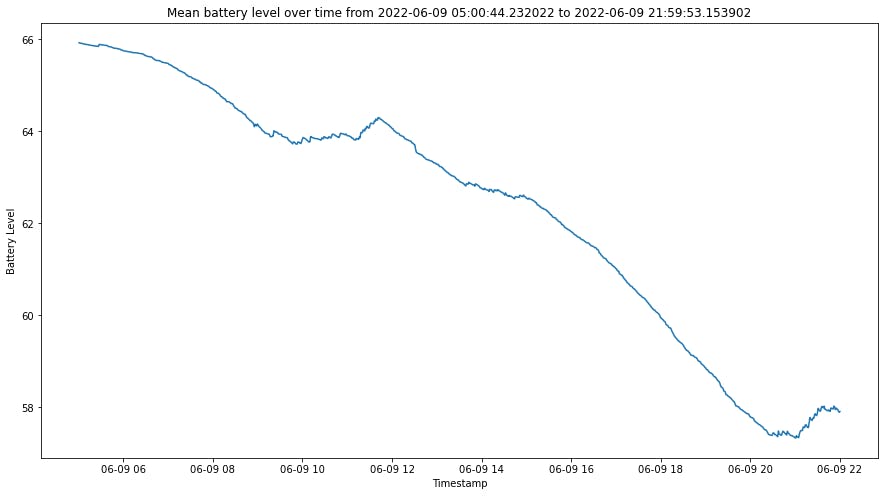
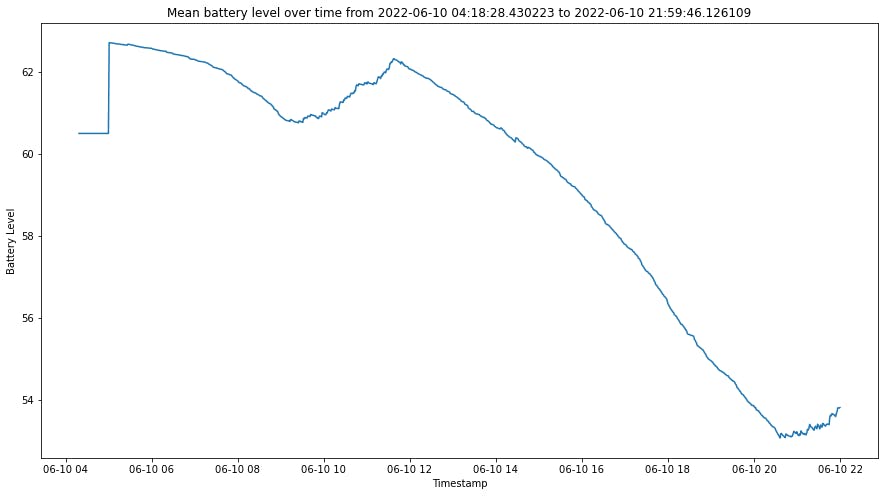
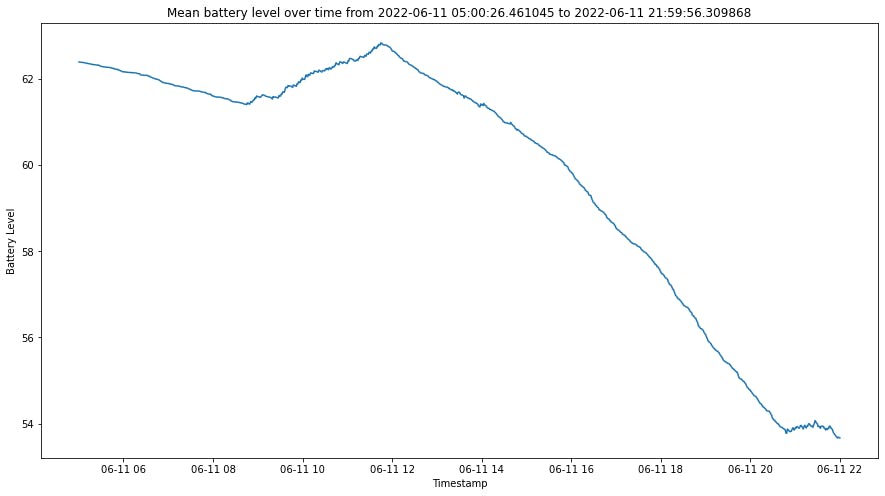
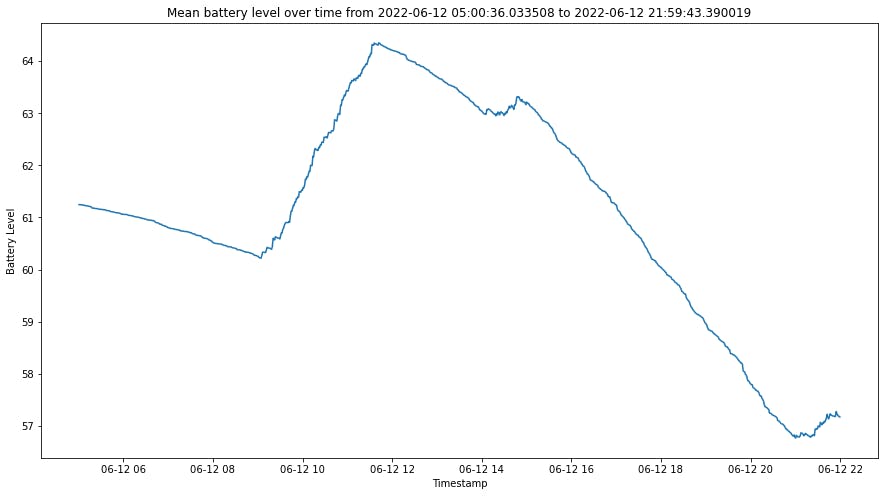
Other days
Now I run this function on other days, and these are the result.
Entire week
For the entire week, from 6/6 Monday to 12/6 Sunday.
What's next
I may try to explain the result of the average battery count, I may also try to start looking into the scooter locations.